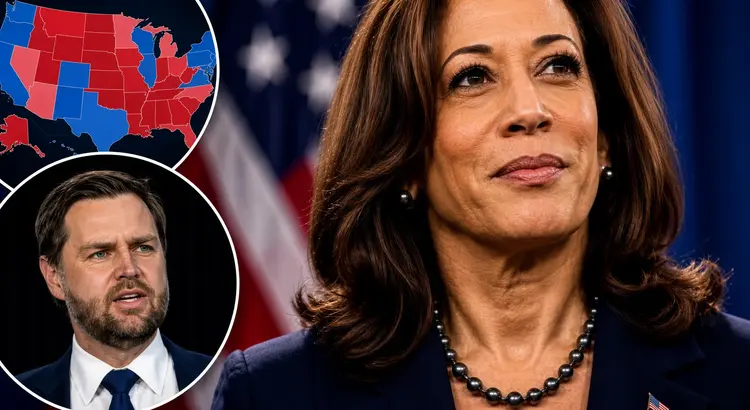
An electoral analysis published this week by analysts at “Election Time” presented a detailed state-by-state breakdown of a hypothetical 2028 matchup, using historical voting data and demographic patterns to project results across all 50 states. The model assigned each state to categories—solid, likely, lean, and tilt—based on observed trends from recent elections and population movements.
The projection identified shifts in regions once considered reliably Democratic. States in the Upper Midwest, including Wisconsin, Michigan, and Pennsylvania, were mapped as moving toward Republican categories based on consecutive Republican victories in 2016 and 2024. Ohio and Iowa, reflecting margins from the 2024 election, were placed in the solid Republican column under the model’s parameters.
The analysis also tracked demographic change across Sun Belt states. Texas, which has been identified as a competitive battleground in recent cycles, was modeled as returning to a solid Republican classification based on 2024 results. States with growing populations, such as Arizona and North Carolina, were assessed as likely Republican under the projection.
The Reaction
Electoral analysts have long debated whether recent voting shifts represent permanent realignment or temporary fluctuations tied to specific candidates and circumstances. This projection joins an ongoing conversation about whether demographic and regional changes are durable enough to reshape the competitive map for 2028.
Political observers have noted that presidential elections often deviate from maps created in off-years, as campaign dynamics, candidate strength, economic conditions, and unforeseen events all influence voter behavior. The role of artificial intelligence in electoral forecasting remains an evolving field, with researchers experimenting with how computational models can incorporate multiple variables into predictions.
The analysis noted that the Midwest represents a critical testing ground for these trends. According to the projection, states that have supported Democratic candidates in past decades may be undergoing a rightward shift driven by shifts in union density, education levels, and cultural factors. The model suggested this regional movement could persist in future election cycles.
What This Means
Electoral maps created during non-election years serve primarily as analytical tools for understanding how current trends might play out under specific scenarios. They highlight which states polling and historical data suggest could be competitive, which are likely safe for each party, and which may be ripe for shifts based on demographic change.
As the 2028 race takes shape over the coming months, actual candidate recruitment, campaign strategy, and real-time events will ultimately determine outcomes far more than pre-election modeling. The projection underscores, however, that both parties’ strategists are closely monitoring whether recent electoral patterns signal sustained changes in regional alignment or represent a narrower phenomenon tied to recent years’ particular political environment.
The next two years will likely see candidates from both parties launching exploratory campaigns, testing their messages in early primary states, and beginning to define the general election battlefield. Maps like this one provide a baseline for measuring how those campaigns shift the political landscape between now and November 2028.